So going back to our t-shirt sizing. Even though the user workflow for SSO is quite short, sharp, and simple, leading you to believe it will
be a small t-shirt size, the actual integration with these accounts is quite complex.
Hence, the shirt size is large to contextualise the complexity.
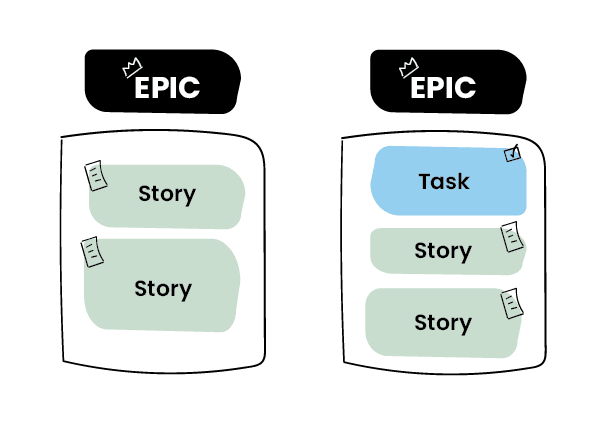
Using this activity is great on a story-by-story basis but is also a great way to show the size of the overall project. The product
developer can demonstrate the size of the project by grouping all of the user stories and their sizes together, and the product owner can
follow along at a high level.
Think of it this way: a pile of laundry consisting of all large t-shirts is going to be larger than a pile of laundry consisting of all
small t-shirts. So, if you only have a small washing machine, you are going to prioritise what can go in that load! Meaning you may pick the
most important shirts to wash first.
To round out this laundry metaphor – the washing machine, is the budget/timeframe…i.e., what the product owner has specified are the
constraints the project must operate within.
2. Fibonacci
What is it?
Taking you back to your primary school mathematics class, this sequence demonstrates the constant addition of numbers using the previous. 0,
1, 1, 2, 3, 5, 8, 13, 21, 34, 55…etc.
We use Fibonacci numbers (or sequencing) to help us
manage the error in our estimations.
We need to remember that estimations are, by definition, already incorrect predictions of the future. They are essentially well-intentioned
guesses.
As such, being too specific with our estimations can result in a larger error rate due to the inherit inaccuracies within the estimates. We
need to give ourselves a buffer margin.
What we generally want to know is relative effort of the work. We can then define a baseline for a well-known item of work (i.e., something
that we estimate at 2 hours is generally very well understood) and multiple out by our factors.
For example, Ticket A is at least twice as much work as Ticket B.
Ticket B may be 2 hours; therefore, Ticket A is estimated at 4 hours.
It is much more challenging to be able to say, Ticket A is 1.3 times as much work as Ticket B.
…Thus, Fibonacci.
Why do we do it?
Similar to t-shirt sizing, this is a way to represent the complexity in each of the user stories in comparison to each other.
Additionally, as I quickly mentioned above, this sequencing pattern allows for us to factor in margin of error, or, more specifically, risk.
It is incredibly important to note that there is an element of risk with everything we develop.
This isn’t meant to scare anyone off, risk is associated with everything. The crucial factor here is what we do with that risk and how do we
scientifically account for it.
At WorkingMouse, we have formed, iterated on and continuously improved our risk management calculation process. This is
calculated as a multiplication of the complexity and the unfamiliarity of each user story.


.png)